Scoring FacilityScoring, sometimes also referred to as weighting, is where a numeric value is assigned to each of a question's answer response options.
A popular format is to use a scale such as in the following example:
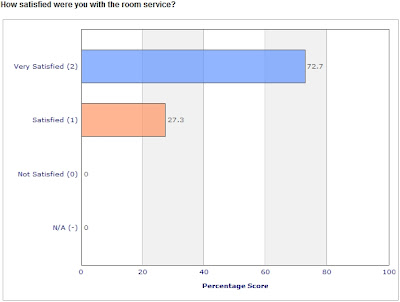
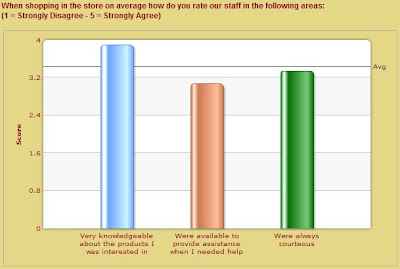
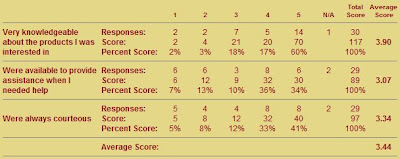
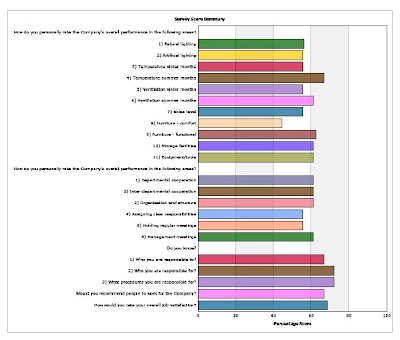
By assigning a score to each answer option it is possible to then benefit from Survey Galaxy's online Results Analyzer's inbuilt score reporting facilities and display the results as both a chart and table as shown below.
and/or as a table,
Using the Results Analyzer's scoring facility a specific value can be assigned to each answer response and will:
- allow a score to be assigned to any type of question/answer format
- support both numeric scale and titled headings
- allow answer options to be ignored such as 'Not Applicable'
- support any ordering of the answer options
- allow the use of the randomise answer facility
- allow the scoring to be unevenly weighted
- allow the use of decimal scores
- support non-English and/or multi-language surveys.
Applying ScoringScoring is assigned to answer options using the Composer, when adding or modifying survey items.
For Non-grid formats the scores are assigned by selecting the
Answer Attributes option under the
Answers field.
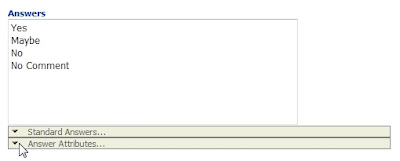
Clicking on the
Answer Attributes button will list the Answers allowing scores to be assigned to each answer option.
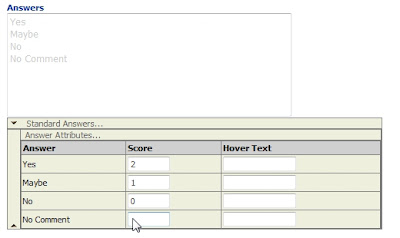
Leaving an answer score blank option will indicate that the response for a person choosing that option will be ignored. This would be used for answers like 'Not Applicable' and 'No Comment'. Leaving an answer score blank is different to assigning a score of zero where the person's response will be counted but no score will be derived from it.
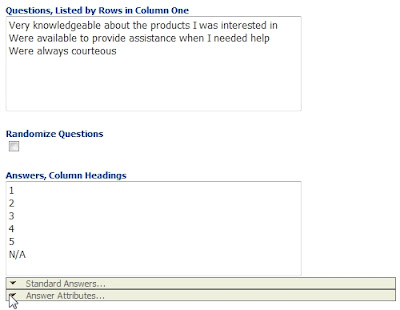
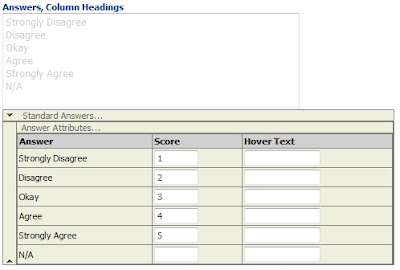
For grid style formats the
Answer Attributes button is displayed under each format's answers, columns headings field:
When selected, the
Answer Attributes option will open up to allow scores to be assigned to each of the listed answer options.
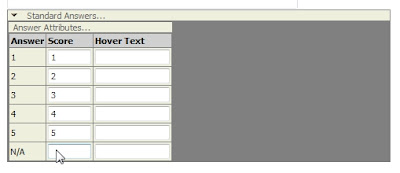
The assigned score can be any positive numeric value including decimal numbers.
Assigning scores to answer options can help improve the clarity of surveys by allowing the publisher to dispense with the need for issuing instructions to the respondent to indicate if an answer option such as 'Strongly Agree' is to be scored high or low.
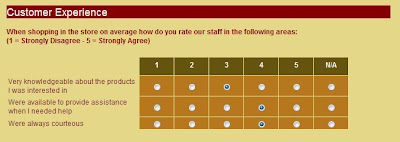
For example, instead of:

The survey can be displayed in a more respondent friendly manner:
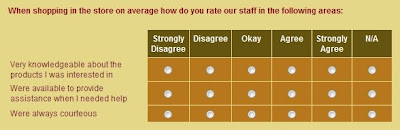
With each scale scores being assigned to each of the column titles:
 Preview the Scoring
An overview of the assigned scoring is automatically displayed in the Composer's preview screen. The scores are only shown in the Composer's
Preview screen, they are not shown if the Preview button is used to preview the survey and they are not shown when the survey is published.
For non-grid formats the scores are shown in brackets as a subscript next to the associated answer option:
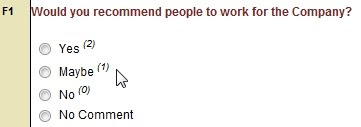
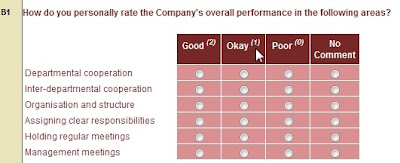
For grid formats the assigned scores are shown in brackets as a subscript in the column headings.
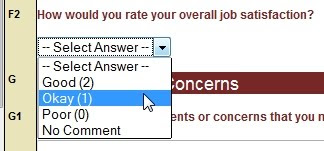
For drop down formats the scores are shown in the preview when the drop down list is shown:
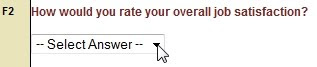
The scores are shown in brackets:
 Results Analyzer Scoring Facilities
If the Results Analyzer detects that scores have been applied to the survey then additional scoring options will be added to the Master Settings section and an additional Survey Scoring Reporting section will be displayed.
Master Settings section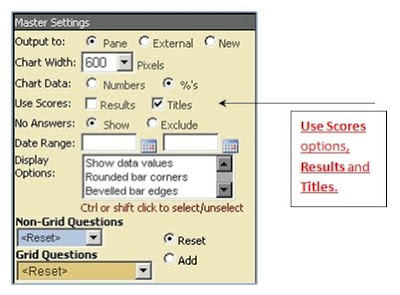 Use Scores: Results
With the Results option checked the assigned scores will be used to determine the value of each response option i.e. number of times the answer has been selected multiplied by that answer option's assigned score.
Use Scores: TitlesThe Titles option will display each answer options assigned score in the titles as shown below:
In addition to the additional Master Settings score options if any scores have been assigned a Survey Scoring Report section will be displayed after the survey item options.
The Survey Scoring report will provide the option to display a chart summary of the scored answers.
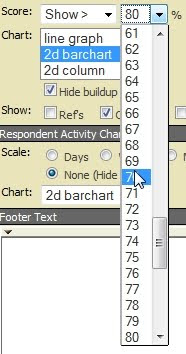
To display the Scoring Summary chart, set the Data to either
Numbers or
%'s, to turn off the chart select
None (Hide Chart).
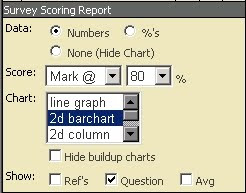
Click on the Result Analyzer's
Apply button to display the chart with the configured settings.
By adjusting the Survey Scoring Report settings the reporting data can be filtered to only show those items that match a defined criteria:
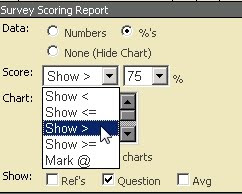
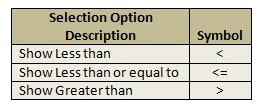
The criteria's value can be set by using the % pick list:
The
Mark @ option will not filter the results but instead will draw a line on the chart marking the specified value on the chart.
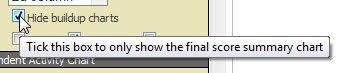
Hide buildup chartsChecking this option will hide the individual charts that are used to build up the score summary chart.
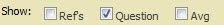
The
Show: options can be configures to configure the chart to show References (Ref's), if they have been assigned, and/or the
Question. If the
Average (Avg) is checked a line will be shown on the chart to indicate the average value.
Individual survey items that are marked as 'Hide' will not be included in the Score Summary Report.
General Notes- When the data has been set to report as a %, the score report will show the % using the formula:-
((Answer option's total score for all included responses/Max possible score of all included responses)*100)
- Leave the score field blank for any answer option such as 'Not Applicable' that is to be excluded from the summary chart and any calculation.
- To revise the scoring of a publish survey the Compose Characteristics option can be used to adjust the scoring without the need to stop the survey publication.
- Scored results are not part of the exported results.
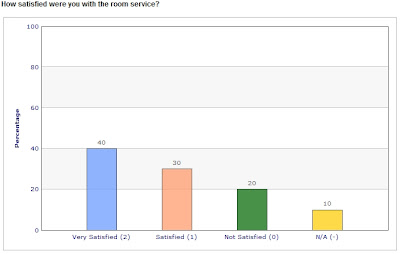
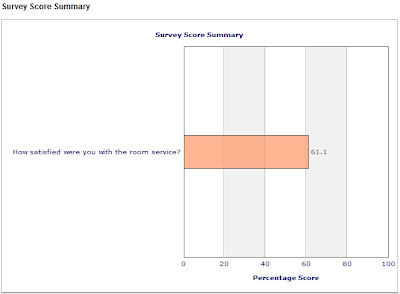
Summary Chart CalculationFor a survey question that offered four answer options, including one Not Applicable (N/A), and having received ten responses, the following illustrates how the overall percentage of maximum score that is shown on the Score report Summary chart is calculated.
The survey score summary chart's reporting value is highlighted in yellow.
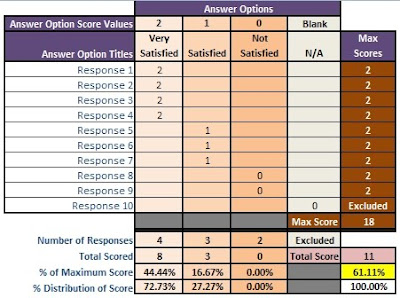
The Survey Score Summary chart will therefore show the example as below:
If the build up charts are shown and the Master Settings configured to display the results as a percentage and also set to use the scores, the chart will be displayed as follows.