Saturday, November 28, 2015

Subjective Questions


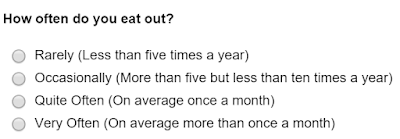
It is quite common to come across surveys that ask questions similar to the one below. 

That the survey publisher, nor for that matter the respondent would find anything particularly wrong with such a question is perhaps the nub of the problem.

The problem is that the answer options, Rarely, Occasionally, Quite Often and Very Often are that they are all subjective answers so what the survey publisher may have considered to be Occasionally the respondent may consider to be Quite Often or even Very Often.

It is okay to use subjective answer options providing they are quantified so that everyone is using the same definition, for example.


In this way it doesn't matter that the respondent has a different definition of what Occasionally means as it is clearly defined.

However, it is also important that the respondent can answer accurately which if they wanted to respond that they eat out five times a year or on average eleven times a year then they would not be able to answer accurately as there is no answer option that specifically caters for those frequencies.

It is also important to note that in the above example Quite Often is qualified but unlike the other answer options it is a very precise answer, whereas the other answer options cover much wider groups.

It is therefore always better to ensure that respondents can answer accurately and that the groupings are relatively consistent such as the example below:




Friday, November 27, 2015

The Problem with Asking Respondents to Respond Using a 1 to 10 Scale

 How often have you seen a survey question that requires the respondent to indicate their opinion by selecting a number between 1 and 10?

Such question formats are not that surprising as it is very common for people to be verbally asked their opinion by being asked to score something from 1 to 10, so why when designing surveys is using a scale in any way wrong?

Asking someone to rate something out of ten is quite acceptable when the intention is to simply gauge a single individual’s opinion, or just to informally test the temperature of a group over a particular topic, but where the intent is to collate meaningful data it can at worse be flawed and at best convoluted.

So what is the problem?  

Ambiguity


Some surveys commit a cardinal survey sin by using a response scale and not advising the respondent as to whether 1 is to be scored low or high causing all the data being collated to be flawed as there is no way of knowing how many people will have answered thinking 1 should be scored high and how many the opposite, so the first rule when using any type of numeric scale is to remove any ambiguity and state clearly as part of the question if 1 is to be scored high or low.


Why 1 to 5 is much better than 1 to 10 or 1 to 100

Regardless of how 1 is to be scored, there are however further considerations one of which is why have the numeric scale set from 1 to 10, or in some cases 1 to 100?

If when analysing survey responses such questions are nearly always divided into five distinct groups such as:
  • "Very Poor", "Poor", "Okay", "Good", "Excellent"
  •  "Strongly Disagree", "Disagree", "Neutral", "Agree", "Strongly Agree"
  •  "Very Satisfied", "Satisfied", "No Opinion", "Dissatisfied", "Very Dissatisfied"


If the collated information is going to be grouped into five distinct groups, it makes sense that the numeric scale is set from 1 to 5 rather than 1 to 10 or 1 to 100 as the scores are only going to be regrouped during the analysis stage.


But why use a numeric scale at all?

Since all numeric scales need to be clarified by associating the numbers to descriptive text, such as "Very Poor", "Poor", "Okay", "Good", "Excellent", why not just cut straight to the chase and use the text descriptions as unlike with numeric scales there is no ambiguity when text is used and there is no need for any further clarification.


In summary

  • If using a numeric scale make sure that you advise the respondent if 1 is to be scored high or low.
  • Unless there is a good reason to do so consider how the collated data is going to be analysed and reported and then seriously consider if using a numeric scale that is from 1 to 5 is better than using a 1 to 10 or 1 to 100 scale.
  • Unless there is a good reason to use numeric scales always consider if it would be better and less complicated to use text descriptions rather than numeric scales, especially if the text descriptions are going to be used in reports when analysing the collated data.

Monday, November 23, 2015

How Long?


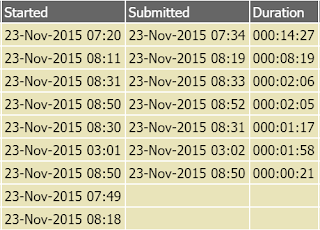
It can be difficult to sometimes gauge how long it takes respondents to complete a survey. However, it is now possible to see how long each respondent took by using the respondent activity menu option as it now displays the survey respondent's start and submit survey times and displays the duration in hours minutes and seconds.


If there is no submittted or duration time that indicates that the survey response is incomplete.

Keep in mind that when using the duration information that it is possible for a respondent to start completing a survey and then for whatever reason stop and continue at a later time, even a later day, so if the duration information is being used to provide future respondents with a realistic time to complete it is recommended that any extreme duration times are excluded from any calculation.

Tuesday, November 17, 2015

Export Survey Results to SPSS Statistics Application

IBM’s SPSS Statistics is a popular software package used for statistical analysis.

For customers who would like the ability to export their Survey Galaxy survey results directly into the SPSS Statistics application there is now an additional export option to include .csv files that are specifically formatted to be imported to SPSS.

There are two options to choose from:

Single file
This will export all the survey results information into a single .csv file.


Separate data files
This will create multiple .csv files for the survey results data split into three files containing the Headings, Result and Values.

Monday, November 16, 2015

Enhanced Grid Styling


Grid Format Style Banding

To improve the visibility of questions entered in into grids new grid style elements have been created. Grid questions can now be given alternating display band attributes and the grid border colour can be set.

The grid style elements that are now available are:
·       Grid Questions, Odd Bands (Default)
·       Grid Questions, Even Bands
·       Grid Body, Odd Bands (Default)
·       Grid Body, Even Bands
·       Grid Borders (Fore Colour Only)

If grid banding is not required then the Even Bands style elements (Grid Questions, Even Bands & Grid Body, Even Bands) are left blank (or cleared) and then banding will be disabled and the odd and even bands will both use the default Grid Questions, Odd Bands (Default) & Grid Body, Odd Bands (Default) style attributes.

If grid banding is required, then first the Odd Bands (Default) style elements should be confirmed or set and then the Even Bands style elements configured.

For example using the survey composer’s Style Customizer screen, the Grid Questions, Odd Bands (Default) element is selected and the Fore Colour is set to crimson (#782727) and the Back Colour to a shade of ocra (#cc9900).


Then the Grid Questions, Even Bands element is selected and the Font Colour is set to white (#ffffff) and the Back Colour to a rusty brown (#cc6600).


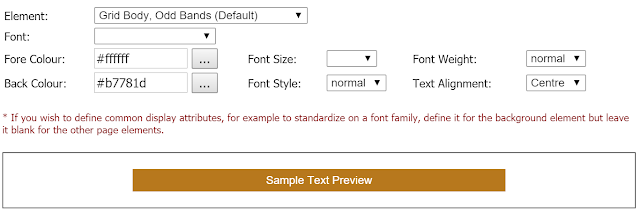
The Grid Body, Odd Bands (Default) Fore Colour is set to White (#ffffff) and the Back Colour to Sand (#b7781d). For this example the Grid Body, Even Bands is not defined as the grid body is not required to be banded.      


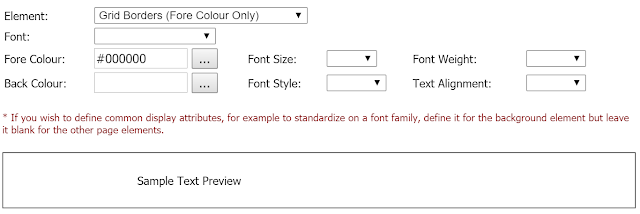
Finally, the Grid Borders (Fore Colour Only) Fore Colour is set to black (#000000) in order to set the colour of the grid borders.


Combined with other attributes that have been set such as the surveys default font, font colour, background colour, grid headings and heading the results of setting the grid style attributes as above results in the following display style.


If the Grid Body, Odd Bands (Default) and Grid Body, Even Bands attributes are changed so that their Back Colours are the same as their respective question’s Back Colour, the result would be as shown below.