Showing posts with label Enhancement. Show all posts

Wednesday, September 28, 2011

New Edit Details Action Button


For more convenient access the survey's Edit Details menu option has been added to the list surveys display action buttons.

Create a Survey - New Folder Option


When you create a survey you now have the folder options to leave the new survey unassigned, assign it to an existing folder or specify a new folder name.

You will be able to change a survey's folder assignment by using the Manage Folders and Assign Folders menu options, or a survey's Edit Details menu option.

Survey File Management Facility

We have now added support to allow folders to be created and assigned to surveys for easier management.

For more details please view the Survey Folder Management tutorial.

Tuesday, September 27, 2011

Survey 'Edit Details' Displayed Reorganized


The survey's Edit Details display options have been re-ordered and reorganized into six sections, General, Runtime, Presentation, Language, Popup and Search Engine Optimisation options; with the exception of the General section, sections can be expanded or collapsed.

You can also now use the Edit Details menu option to assign individual surveys to predefined folders.

The Public Decide Blog - Public Surveys

A new Blog, The Public Decide, has been associated to the main Survey Galaxy website.

The Public Decide blog features fun and topical public surveys for all the family.

The link, Public Surveys, can be found on the home page in the footer section.

Monday, August 29, 2011

Enhancement - Response Capture Facility Updated

The Response Capture facility has been reworked to make it easier to enter response data from external sources, remove unwanted and modify existing responses.

To activate the facility, select the survey that you wish to modify, then use the Capture menu option.

The Capture menu will only be displayed for surveys that have been previously published, changes can be made to surveys that are no longer published but the facility will only operate on the latest dataset.

Monday, July 25, 2011

New Progress Bar Styles Added

In addition to the new Slider formats announced in yesterdays posting we have also added a number of new progress bar styles.

As with the slider formats, to select an alternative progress bar style use the Composer Pane's Styles Defaults facility, click on the current progress bar style and you will be able to then select an alternative from the list of available styles.

When displayed, the progress bar will show the respondent the percentage of the survey that has already been completed, the percentage of the survey that the current page represents and the percentage of the survey that is still remaining.

Sunday, July 24, 2011

New Slider Styles Added


A number of new slider styles have been added.

The survey slider style can be changed through the Composer's Preview Pane Styles Defaults menu option.

Click on the currently selected style to view and select an alternative style.

The slider style for published surveys can be changed through the Compose Characteristics facility.

Wednesday, April 06, 2011

Results Analyzer Report Key Facility

Members that make regular use of the online Results Analyzer's Report key facility will already know and appreciate how useful the facility is.

For those that are unfamiliar with the facility the report key allows you to specify a respondent's answer as a key and then associate that value to other responses.

For example if you have requested the respondent's name you can specify their name as the report key and have their name appear against any comments that they made, or against other free text answers.

For more information please view the Defining a Report Key tutorial.


For those that are already familiar with Report Key facility please be advised that we have made an improvement with the grouping of Report Keys with the same value whereby blank values, (or 'no response' data), will in future be identified by having a Report key group value of <Blank>.

Tuesday, March 29, 2011

Improvements to the Styles Defaults Facility

A number of improvements have been made to the survey Styles Defaults display.

Background Images

You can now specify a background image by selecting from our library of background images. For example if you want to have your survey appear as though it were written on paper select one of the paper background images.


Select Style of Slider and Progress Bar

We have also made it possible to select from a number of different styles for the Progress bar and the Slider format. We plan to add more style options over time.


Monday, January 10, 2011

New Slider Format

A new Slider Question/Answer format has been added to the Survey Galaxy Composer allowing respondents to register their degree of desirability between two conditions.

The following is a screen shot of a sample survey using the slider format to determine to what extent the respondent Agrees or Disagrees with a particular statement.


The new slider format is an extension of the Data Entry Field format.


Choose the Slider format from the Field Data Type selection list, specify the Left and Right answers then click on the Save button.


Results Analyzer

When the slider results are analysed through the online Results Analyzer the report will show the degree that all respondents chose between the two answer options.


To view a sample survey containing questions utilising the slider format try the Sample Survey - Slider Format

Monday, January 03, 2011

New Feature for 2011

We would like to wish all our Member's the very best for the New Year and are pleased to introduce a new feature that will enable the Results Analyzer report to be exported to Microsoft Word format and for the individual charts to be displayed as a Microsoft PowerPoint presentation and also supply the Flash charts as separate BMP images.

An Export button that will activate the facility has replaced the Results Analyzer's Print button.


The Export button will display a selection of Export formats and provides the facility to include a reference which may prove useful if the reports are using filtered results, in which case the reference could be for example "Male only Responses".


Once submitted the request will be queued for processing and when completed a confirmation Email sent providing a link to the requested formats. The documents are delivered in a zipped format protected with the Member's case sensitive Survey Galaxy password.

The charts can be supplied as individual static BMP images and/or as Flash object's that will provide the full Flash interactive experience such as hover text and for pie and doughnut formats, rotation and slicing.

Downloads will also be listed in the Results Export section of the Show Survey Details screen.

Tuesday, October 05, 2010

Enhancement - Mandatory Checkbox Options

An enhancement has been released that extends the mandatory configuration options for Checkboxes for Multiple Choices formats. It is now possible to configure the item so that respondents are required to select a minimum and/or maximum number of selections.

Changes can be made at the survey item detailed level, or from the Preview Pane’s Mandatory mode setting. Configuring the mandatory Minimum and Maximum selections can also be done through the Compose Characteristics facility allowing changes to a published survey to be made without the need to stop the survey publication.


An example of where this would prove useful is if there was a requirement for a survey to request the respondent to select five items from a list of twenty answer options; where for example the maximum number of selections can be set to five and the minimum number can be set to none, one, two, three, four or five depending on the survey requirements.

Sunday, October 03, 2010

Enhancement

For radio or checkbox formats questions, where the number of answer options are more than twelve, the answer options format will automatically revert to display the answer options horizontally, in columns, in the order from left to right and then down.

Sunday, May 16, 2010

Data Entry & Ranking Formats now support textbox formats

The Data Entry & Ranking Fields grid format has been improved with the Define Column Attribute facility now supporting the multiple row textbox data type.

The size of the textbox can be specified by entering the number of columns and rows to be used in the Field Size parameter box using the format: col,row; for example 50,5 would indicate a textbox field size of 50 columns and 5 rows.

If no size is specified the default size is 20,3.

To view an example of a grid using textbox, text and date formats please view the Sample of Data Entry & Ranking format using the textbox, text and date formats.

Monday, May 03, 2010

Enhancement - Scoring & Weighting

Scoring Facility

Scoring, sometimes also referred to as weighting, is where a numeric value is assigned to each of a question's answer response options.

A popular format is to use a scale such as in the following example:
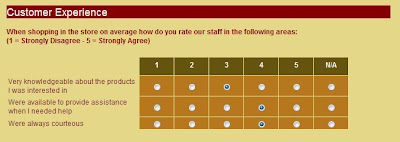


By assigning a score to each answer option it is possible to then benefit from Survey Galaxy's online Results Analyzer's inbuilt score reporting facilities and display the results as both a chart and table as shown below.
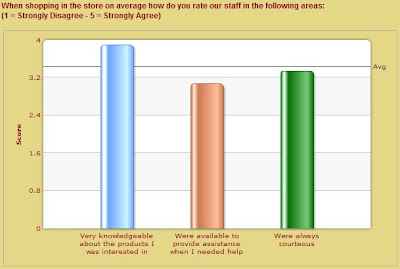


and/or as a table,
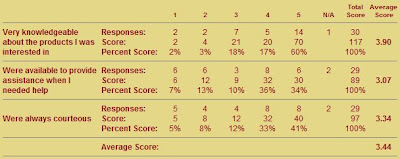


Using the Results Analyzer's scoring facility a specific value can be assigned to each answer response and will:
  • allow a score to be assigned to any type of question/answer format
  • support both numeric scale and titled headings
  • allow answer options to be ignored such as 'Not Applicable'
  • support any ordering of the answer options
  • allow the use of the randomise answer facility
  • allow the scoring to be unevenly weighted
  • allow the use of decimal scores
  • support non-English and/or multi-language surveys.


Applying Scoring

Scoring is assigned to answer options using the Composer, when adding or modifying survey items.

For Non-grid formats the scores are assigned by selecting the Answer Attributes option under the Answers field.
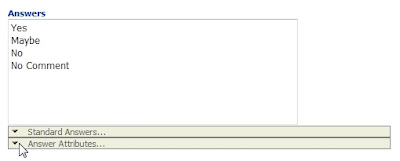


Clicking on the Answer Attributes button will list the Answers allowing scores to be assigned to each answer option.
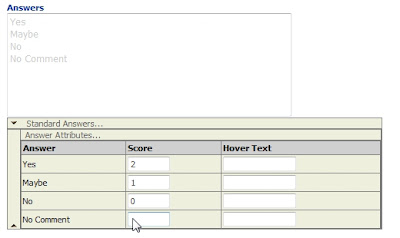


Leaving an answer score blank option will indicate that the response for a person choosing that option will be ignored. This would be used for answers like 'Not Applicable' and 'No Comment'. Leaving an answer score blank is different to assigning a score of zero where the person's response will be counted but no score will be derived from it.

For grid style formats the Answer Attributes button is displayed under each format's answers, columns headings field:
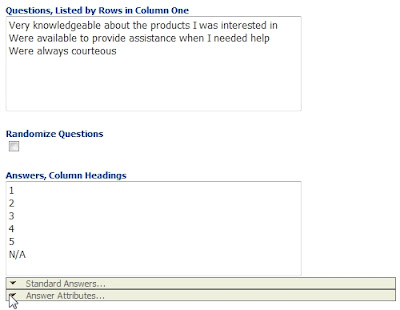


When selected, the Answer Attributes option will open up to allow scores to be assigned to each of the listed answer options.
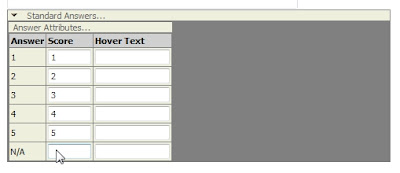


The assigned score can be any positive numeric value including decimal numbers.

Assigning scores to answer options can help improve the clarity of surveys by allowing the publisher to dispense with the need for issuing instructions to the respondent to indicate if an answer option such as 'Strongly Agree' is to be scored high or low.

For example, instead of:
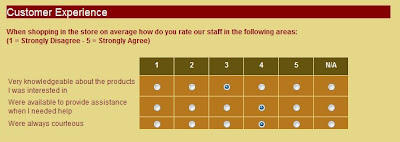


The survey can be displayed in a more respondent friendly manner:
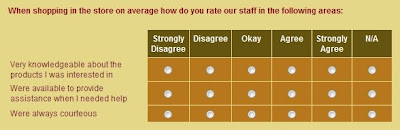


With each scale scores being assigned to each of the column titles:
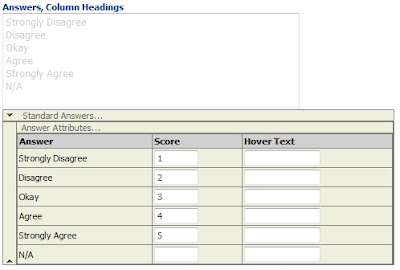


Preview the Scoring

An overview of the assigned scoring is automatically displayed in the Composer's preview screen. The scores are only shown in the Composer's Preview screen, they are not shown if the Preview button is used to preview the survey and they are not shown when the survey is published.

For non-grid formats the scores are shown in brackets as a subscript next to the associated answer option:
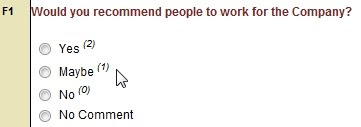


For grid formats the assigned scores are shown in brackets as a subscript in the column headings.
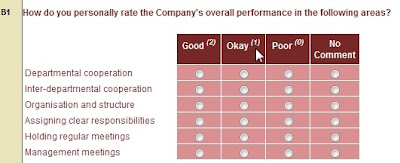


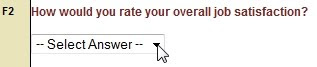
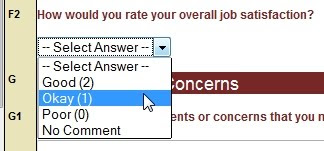
For drop down formats the scores are shown in the preview when the drop down list is shown:


The scores are shown in brackets:


Results Analyzer Scoring Facilities

If the Results Analyzer detects that scores have been applied to the survey then additional scoring options will be added to the Master Settings section and an additional Survey Scoring Reporting section will be displayed.

Master Settings section
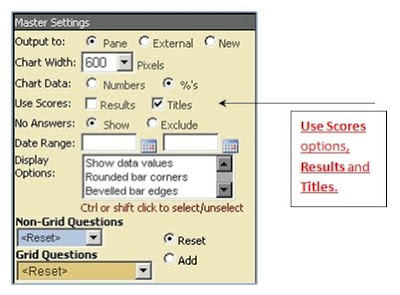


Use Scores: Results

With the Results option checked the assigned scores will be used to determine the value of each response option i.e. number of times the answer has been selected multiplied by that answer option's assigned score.

Use Scores: Titles

The Titles option will display each answer options assigned score in the titles as shown below:
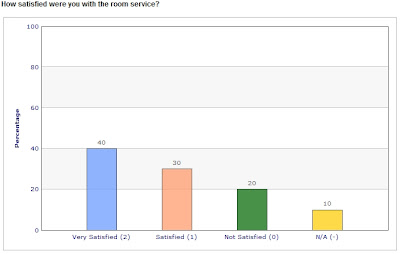


In addition to the additional Master Settings score options if any scores have been assigned a Survey Scoring Report section will be displayed after the survey item options.

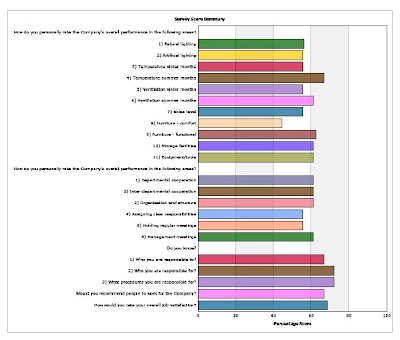
The Survey Scoring report will provide the option to display a chart summary of the scored answers.

To display the Scoring Summary chart, set the Data to either Numbers or %'s, to turn off the chart select None (Hide Chart).
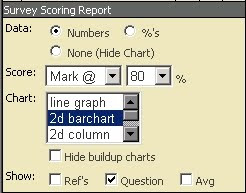


Click on the Result Analyzer's Apply button to display the chart with the configured settings.


By adjusting the Survey Scoring Report settings the reporting data can be filtered to only show those items that match a defined criteria:
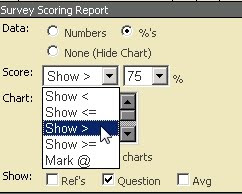
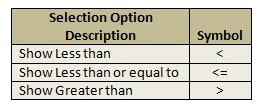


The criteria's value can be set by using the % pick list:
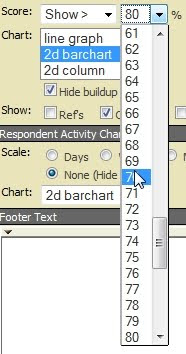


The Mark @ option will not filter the results but instead will draw a line on the chart marking the specified value on the chart.

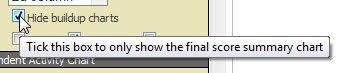
Hide buildup charts

Checking this option will hide the individual charts that are used to build up the score summary chart.


The Show: options can be configures to configure the chart to show References (Ref's), if they have been assigned, and/or the Question. If the Average (Avg) is checked a line will be shown on the chart to indicate the average value.



Individual survey items that are marked as 'Hide' will not be included in the Score Summary Report.

General Notes

  • When the data has been set to report as a %, the score report will show the % using the formula:-
    ((Answer option's total score for all included responses/Max possible score of all included responses)*100)

  • Leave the score field blank for any answer option such as 'Not Applicable' that is to be excluded from the summary chart and any calculation.
  • To revise the scoring of a publish survey the Compose Characteristics option can be used to adjust the scoring without the need to stop the survey publication.
  • Scored results are not part of the exported results.


Summary Chart Calculation

For a survey question that offered four answer options, including one Not Applicable (N/A), and having received ten responses, the following illustrates how the overall percentage of maximum score that is shown on the Score report Summary chart is calculated.

The survey score summary chart's reporting value is highlighted in yellow.
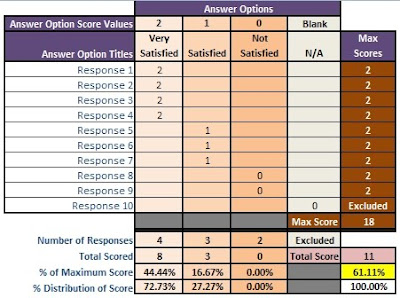


The Survey Score Summary chart will therefore show the example as below:
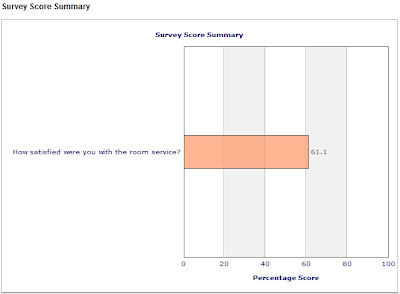


If the build up charts are shown and the Master Settings configured to display the results as a percentage and also set to use the scores, the chart will be displayed as follows.
Sunday, January 03, 2010

Enhancements

We start 2010 off with a few new enhancements to the online Results Analyzer.

Enhancement 1

The online Results Analyzer now features a date selection in the Master Settings section that will allow the results to be analyzed for responses received between any specified start and end dates.


Enhancement 2

The online Results Analyzer also now features three new display format that are designed specifically for Grid formats that use scores as headings, (i.e. such as when a scale of 1 to 5 is used). The three score display formats are a score table that will display the total and average scores; a score chart that will show the results as a chart and includes an average; and a combo that will display the score chart followed by the score table.

For a working sample please complete the Sample Score Survey which will then display the results using the Chart and Table combo.

Enhancement 3

Improvements have also been made to the way x-axis chart labels are displayed to improve their clarity.

Wednesday, April 01, 2009

New Facility - Pop-up survey invitation


A new facility has been introduced that will allow our members to configure and customize a pop-up survey invitation that can then be launched by their own or third-party website.

The facility can be enabled and disabled via a survey's Edit Details menu option. For the pop-up to work the HTML activation code, that is provided through the Edit Details facility will need to be added to the website that the pop-up invitation is to be displayed.

The criteria that is used to display the pop-up invitation can be set to display after so many visitors, page displays or seconds after a page has displayed. More information can be found by referring to the Pop-Up Invitation documentation.

Friday, September 05, 2008

Online Results Analyzer Enhancements

We are pleased to report that the Header and Footer elements of the online Results Analyzer have now been improved to provide WYSIWYG style editing. If required you are still able to switch to HTML source code mode for more advanced style formatting.

The online Results Analyzer will also now display a warning message to remind users of privacy and confidentiality issues whenever public access is set to anything other than deny.

Friday, May 09, 2008

Enhancement - Survey publication dates set in the future

A feature of Survey Galaxy is that you can publish a survey with a start date set in the future.

An enhancement has now been released that will allow the author, of a survey that is published on pay-as-you-go basis with a publication start date set in the future, to complete the survey prior to the specified publication start date so that they can fully test the survey.

Please note that test data can be purged prior to the official survey start date.