Saturday, September 11, 2010

Apologies for Unplanned Outage

The Survey Galaxy team would like to apologise to all our members for the outage that we experienced 9/10 September.

The outage was the result of us moving our servers to a new building.

We had expected to be offline for just a couple of hours but unfortunately the reconfiguring of our Internet connection did not go according to plan and we were forced to wait for our ISP to make good the connection.

We apologise for any inconvenience that this loss of service may have caused.

Thursday, September 02, 2010

Important Announcement - Scheduled Maintenance

Survey Galaxy need to carry out essential maintenance work on our servers commencing Thursday, 9th September 2010 at 18:00 GMT BST. We expect the work will last for approximately 2 hours. Unfortunately, during this period our systems will be unavailable. We apologise for any inconvenience that this may cause.

Sunday, May 16, 2010

Data Entry & Ranking Formats now support textbox formats

The Data Entry & Ranking Fields grid format has been improved with the Define Column Attribute facility now supporting the multiple row textbox data type.

The size of the textbox can be specified by entering the number of columns and rows to be used in the Field Size parameter box using the format: col,row; for example 50,5 would indicate a textbox field size of 50 columns and 5 rows.

If no size is specified the default size is 20,3.

To view an example of a grid using textbox, text and date formats please view the Sample of Data Entry & Ranking format using the textbox, text and date formats.

Monday, May 03, 2010

Enhancement - Scoring & Weighting

Scoring Facility

Scoring, sometimes also referred to as weighting, is where a numeric value is assigned to each of a question's answer response options.

A popular format is to use a scale such as in the following example:
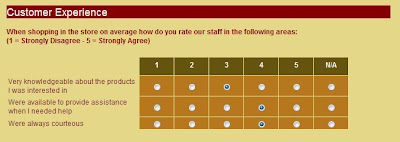


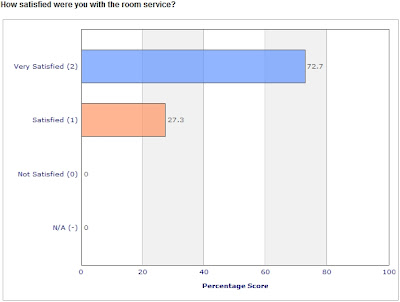
By assigning a score to each answer option it is possible to then benefit from Survey Galaxy's online Results Analyzer's inbuilt score reporting facilities and display the results as both a chart and table as shown below.
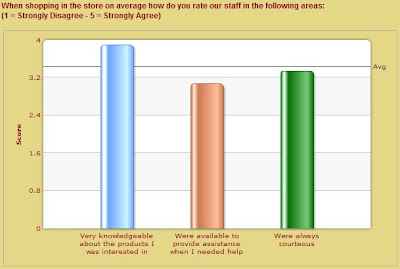


and/or as a table,
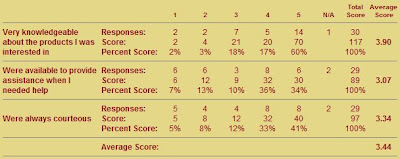


Using the Results Analyzer's scoring facility a specific value can be assigned to each answer response and will:
  • allow a score to be assigned to any type of question/answer format
  • support both numeric scale and titled headings
  • allow answer options to be ignored such as 'Not Applicable'
  • support any ordering of the answer options
  • allow the use of the randomise answer facility
  • allow the scoring to be unevenly weighted
  • allow the use of decimal scores
  • support non-English and/or multi-language surveys.


Applying Scoring

Scoring is assigned to answer options using the Composer, when adding or modifying survey items.

For Non-grid formats the scores are assigned by selecting the Answer Attributes option under the Answers field.
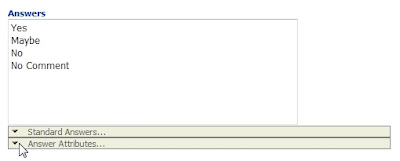


Clicking on the Answer Attributes button will list the Answers allowing scores to be assigned to each answer option.
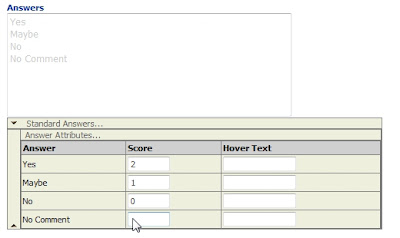


Leaving an answer score blank option will indicate that the response for a person choosing that option will be ignored. This would be used for answers like 'Not Applicable' and 'No Comment'. Leaving an answer score blank is different to assigning a score of zero where the person's response will be counted but no score will be derived from it.

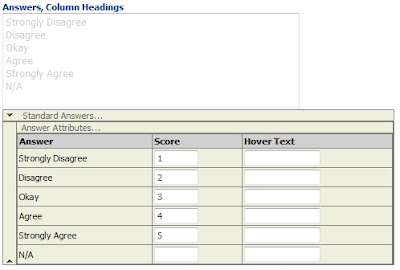
For grid style formats the Answer Attributes button is displayed under each format's answers, columns headings field:
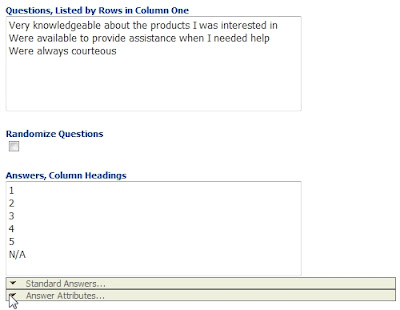


When selected, the Answer Attributes option will open up to allow scores to be assigned to each of the listed answer options.
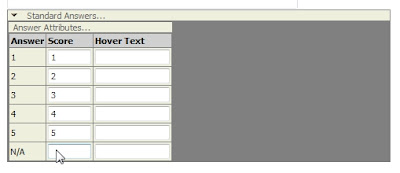


The assigned score can be any positive numeric value including decimal numbers.

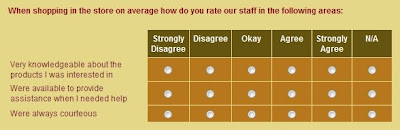
Assigning scores to answer options can help improve the clarity of surveys by allowing the publisher to dispense with the need for issuing instructions to the respondent to indicate if an answer option such as 'Strongly Agree' is to be scored high or low.

For example, instead of:
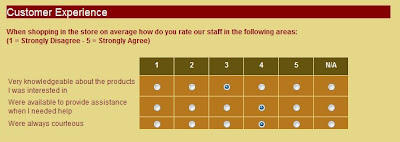


The survey can be displayed in a more respondent friendly manner:


With each scale scores being assigned to each of the column titles:


Preview the Scoring

An overview of the assigned scoring is automatically displayed in the Composer's preview screen. The scores are only shown in the Composer's Preview screen, they are not shown if the Preview button is used to preview the survey and they are not shown when the survey is published.

For non-grid formats the scores are shown in brackets as a subscript next to the associated answer option:
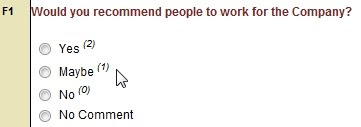


For grid formats the assigned scores are shown in brackets as a subscript in the column headings.
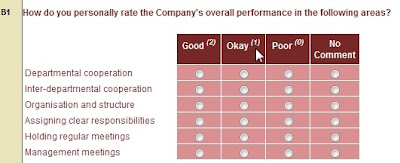


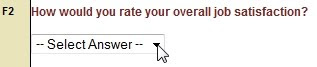
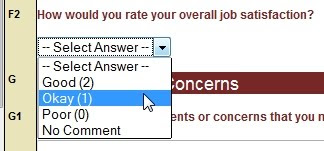
For drop down formats the scores are shown in the preview when the drop down list is shown:


The scores are shown in brackets:


Results Analyzer Scoring Facilities

If the Results Analyzer detects that scores have been applied to the survey then additional scoring options will be added to the Master Settings section and an additional Survey Scoring Reporting section will be displayed.

Master Settings section
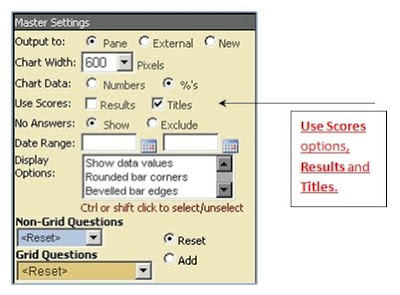


Use Scores: Results

With the Results option checked the assigned scores will be used to determine the value of each response option i.e. number of times the answer has been selected multiplied by that answer option's assigned score.

Use Scores: Titles

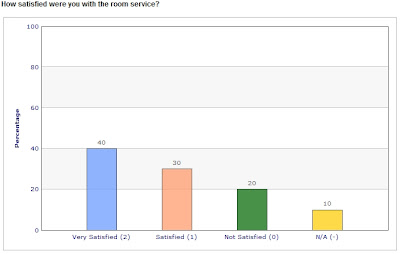
The Titles option will display each answer options assigned score in the titles as shown below:


In addition to the additional Master Settings score options if any scores have been assigned a Survey Scoring Report section will be displayed after the survey item options.

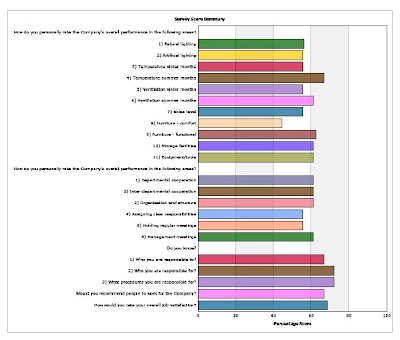
The Survey Scoring report will provide the option to display a chart summary of the scored answers.

To display the Scoring Summary chart, set the Data to either Numbers or %'s, to turn off the chart select None (Hide Chart).
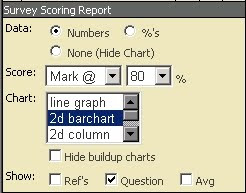


Click on the Result Analyzer's Apply button to display the chart with the configured settings.


By adjusting the Survey Scoring Report settings the reporting data can be filtered to only show those items that match a defined criteria:
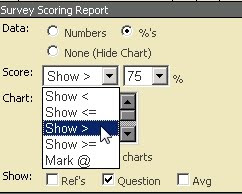
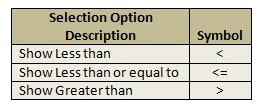


The criteria's value can be set by using the % pick list:
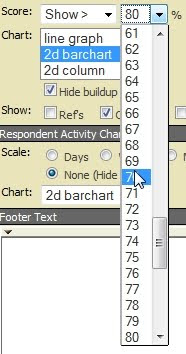


The Mark @ option will not filter the results but instead will draw a line on the chart marking the specified value on the chart.

Hide buildup charts

Checking this option will hide the individual charts that are used to build up the score summary chart.
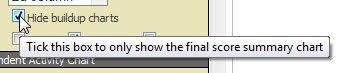


The Show: options can be configures to configure the chart to show References (Ref's), if they have been assigned, and/or the Question. If the Average (Avg) is checked a line will be shown on the chart to indicate the average value.



Individual survey items that are marked as 'Hide' will not be included in the Score Summary Report.

General Notes

  • When the data has been set to report as a %, the score report will show the % using the formula:-
    ((Answer option's total score for all included responses/Max possible score of all included responses)*100)

  • Leave the score field blank for any answer option such as 'Not Applicable' that is to be excluded from the summary chart and any calculation.
  • To revise the scoring of a publish survey the Compose Characteristics option can be used to adjust the scoring without the need to stop the survey publication.
  • Scored results are not part of the exported results.


Summary Chart Calculation

For a survey question that offered four answer options, including one Not Applicable (N/A), and having received ten responses, the following illustrates how the overall percentage of maximum score that is shown on the Score report Summary chart is calculated.

The survey score summary chart's reporting value is highlighted in yellow.
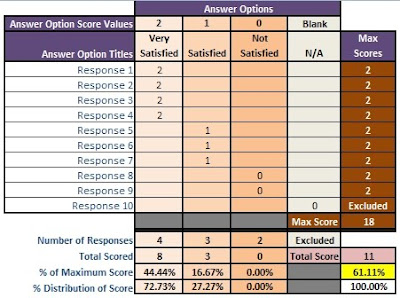


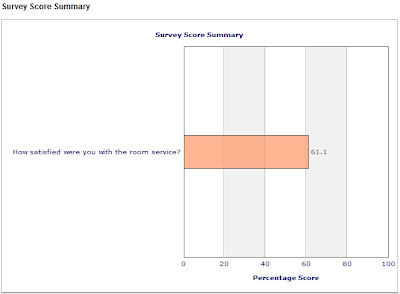
The Survey Score Summary chart will therefore show the example as below:


If the build up charts are shown and the Master Settings configured to display the results as a percentage and also set to use the scores, the chart will be displayed as follows.
Sunday, January 03, 2010

Enhancements

We start 2010 off with a few new enhancements to the online Results Analyzer.

Enhancement 1

The online Results Analyzer now features a date selection in the Master Settings section that will allow the results to be analyzed for responses received between any specified start and end dates.


Enhancement 2

The online Results Analyzer also now features three new display format that are designed specifically for Grid formats that use scores as headings, (i.e. such as when a scale of 1 to 5 is used). The three score display formats are a score table that will display the total and average scores; a score chart that will show the results as a chart and includes an average; and a combo that will display the score chart followed by the score table.

For a working sample please complete the Sample Score Survey which will then display the results using the Chart and Table combo.

Enhancement 3

Improvements have also been made to the way x-axis chart labels are displayed to improve their clarity.

Friday, January 01, 2010

Saturday, July 04, 2009

Snap Polls

Snap Polls are a convenient way to quickly pose a question to your audience in situations where a full survey is not practical or not required.

Snap Polls can be used to check the mood on an important issue and/or as a quick preliminary research ahead of a more comprehensive survey. They can be related to serious topics or equally used as a bit of fun and in that capacity they are commonly used on the home page of websites as a way of engaging with website visitors.

Thursday, July 02, 2009

Writing Effective Surveys and Questionnaires Top Tips

Writing surveys is easy; or is it? The reality is that writing surveys is easy but writing effective surveys is more difficult. The following are twenty tips that if followed will help you with your survey questionnaire design and help you write effective surveys.

1. What is the purpose of the survey?

There are many reasons for conducting surveys. By phrasing the questions and structuring the answers surveys can be used in a multitude of ways and for a variety of reasons. When designing a survey do not lose sight of its purpose.

2. Title the survey

The title of the survey is an opportunity to instantly summarise a survey's objective and encourage respondents to participate. Respondents need to invest time in completing the survey so encourage them that the investment they make will be worthwhile.

3. Ensure that you do not make the survey any longer than it needs to be

Every question asked should be asked for a reason. Minimize asking questions that will provide you with 'nice to know' information and concentrate instead on 'need to know' questions.

4. Use plain English, maintain consistency, avoid jargon and acronyms and don't ask questions that may result in ambiguous answers

Care must be taken in wording a question. If a question can be interpreted in more ways than one then there is a risk that any analysis of the survey results will be worthless or at the very least suspect.

5. Don't have long questions

Use concise sentences wherever possible. Long questions can cause a respondent discomfort and lead to them abandoning the survey.

6. Ask only one question at a time

Avoid confusing the respondent with a question like 'Do you like athletics and tennis?'

7. Don't influence the answer

It is important not to load the question. 'Should irresponsible shop keepers who sell cigarettes to minors be prosecuted?' is likely to have no value.

8. Make sure that the answer format used allows the respondent to answer the question being asked

Ensure that the respondent is able to answer how they really feel or they may abandon the survey. As a last resort consider the benefit of including a "No comment", "Can't say", "Don't know" or similar response option.

9. While you are compiling your survey consider how the survey results are going to be analysed when the survey is complete


When asking questions that allow for a free text open ended response, such as when asking the respondent for their comments, appreciate that such information is likely to be difficult to score and/or summarised. Consider how the answers could be grouped. For example "Indicate your length of service?" - 'less than 1 year', 'between 1 and 4 years' and 'more than 4'.

10. Ensure that the questionnaire flows

Group the questions into clear categories as this makes the task of completing the survey easier for the participants.

11. Target your respondents carefully

Sometimes you will want to target a specific group, in others a cross section. If you can't easily control the respondents consider including questions/answers that will allow you to filter out respondents that don't match your target profile.

12. Allow the respondent to expand on their answer or make comments

Allowing respondents to make additional comments will increase their satisfaction level and the comments will also give valuable feedback on the specific questions and/or the survey as a whole. Remember though for a large sample collection it may be difficult to analyze free text open ended responses.

13. If you are conducting a confidential survey ensure that your pledge for confidentiality is honoured

If you have assured respondents that the survey is to be confidential you need to ensure that the collated data is not shared with anyone or used for any other purpose. Confidentiality must be maintained and any contact information deleted after the survey is complete.

14. Consider the benefits and disadvantages of allowing respondents to be anonymous or identifiable

If your respondents are to be anonymous then you will be unable to follow up specific complaints or match "pre" or "post" surveys. However in some cases allowing respondents to remain anonymous will allow respondents to respond without possible peer pressure.

15. Carefully consider the best response format

Maintaining a consistency in the format used for responses is good practice. When creating your survey keep in mind that when analyzing the data radio buttons are easier to analyze than check boxes that offer the respondent multiple responses. Do not use a check box if a radio response would do.

16. Give the respondent an estimate as to how much time the survey will take to complete

If the survey appears to be a stream of never ending questions then respondent drop out can occur. It is good practice to give an indication as to how long the survey is likely to take so that the participants can choose the best time to complete the survey.

17. Provide respondents with the survey end date

Encourage respondents to complete the survey as soon as possible but advise respondents as to the survey’s end date so that they have the opportunity to schedule the necessary time.

18. Trial the survey

Before publishing a live survey publish the survey as a trial to check for questions that are ambiguous or confusing and to ensure that the survey is aesthetically pleasing.

19. Before publishing the survey proof read the survey carefully

Check and check again that the survey is grammatically correct and makes sense. If practical get a colleague to check the survey before you publish, if no one else is available then take a break before checking again.

20. Thank the respondents

To complete surveys respondents need to invest their time and they should be thanked at the end of completing the survey or in a follow up letter. You may even want to consider incentives such as a reward of some sort.

Getting started is easy and there are many survey software websites to choose from.

b2b Customer Satisfaction Survey

Companies that are part of the supply chain such as manufacturers and wholesalers can often benefit enormously by conducting their own b2b customer satisfaction survey.

Improving the relationship between wholesalers and their suppliers and also between wholesalers and retailers brings potential benefits that will help improve the product in terms of:

  • Quality, range and design
  • Delivery method, speed
  • Communication, method and level of service
  • Payment, quality of documentation and settlement time
  • Prices, wholesale and retail price

A manufacturer can improve the relationship that they have with their wholesalers to the extent that the wholesalers would need to think long and hard before they switched to a rival supplier. For example by improving the communication and being proactive in automating much of the paperwork a manufacturer can add value to the entire product range and that may be just enough to encourage a wholesaler to invest time in resolving any potential problem as opposed to making it easy for them to dictate terms by threatening to switch to a rival supplier. By improving a business to business relationship the products that are supplied will become less of a commodity item and judged along with the whole fulfilment service, a service that may not be available with any Tom, Dick or Harry.

Wholesalers are often doing themselves a disservice if they only focus on price and do not adequately value the many benefits of working with a professional and well organised supplier, a supplier that will deliver on time, will supply products that meet strict the agreed quality and that have invoice and delivery documentation that is clear and accurate.

By conducting customer satisfaction surveys aimed not at the end user but at those involved in the supply chain there are many rewards to be had. It takes a degree of understanding and consideration as to the requirement of the other to establish good and streamlined business processes between any two organizations. With the introduction of more efficient order fulfilment programmes the manufacturer and wholesaler can both benefit.

It is in the interest of manufacturers to establish long term contracts as that will provide them with the security that is necessary for them to plan and reinvest, confident that their customers value the benefits that long term relationships can bring. By manufacturers and wholesalers working together the whole fulfilment process can be streamlined and companies can work towards a just in time model where the need to hold large volumes of stock is reduced and along with all the associated costs.

The starting point for such an exercise is an exchange of information that can be obtained easily by utilising online customer satisfaction survey software that is now widely available and that makes the whole intelligence gathering process quick, easy and cost effective.